作者:張傑
 3收藏
3收藏

 9二手徵求有驚喜
定價:NT$ 780
優惠價:9 折,NT$ 702
運送方式:超商取貨、宅配取貨
銷售地區:全球
訂購後,立即為您進貨



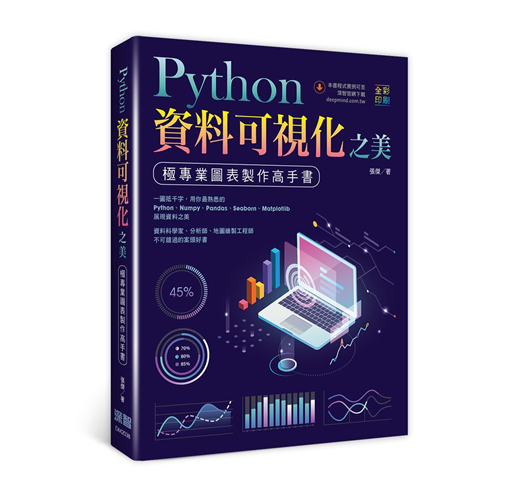
全書從Python程式語言切入,讓不懂Python的讀者也能快速上手。之後介紹處理數值最重要的套件包括NumPy和Pandas,接下來就是Python最重要的繪圖套件,包括matplotlib、Seaborn和plotnine的圖形語法,以及資料視覺化的顏色主題運用原理。在熟悉了工具之後,就進入本書的高潮,製作各式各樣的圖表,包括直條圖系列、橫條圖系列、南丁格爾玫瑰圖、徑向柱圖等圖表。還有資料關聯式圖表,包含二維和三維散點圖、氣泡圖、等高線圖、立體曲面圖、三元相圖、二維和三維瀑布圖、相關係數熱力圖等。最後更直接畫出了「商業週刊」、「華爾街日報」、「經濟學人」等刊物中最專業的圖表,直接晉升成大師行列。
作者簡介:
張傑
【獅猿狗】數據分析-工業設計獅,程序猿,科研狗。微信公眾號【EasyShu】聯合主創。
著有15篇SCI(E)和SSCI學術論文;出版專著《Excel 數據之美:科學圖表與商業圖表的繪製》、《R語言數據可視化之美:專業圖表繪製指南》、《Python數據可視化之美:專業圖表繪製指南》。
多屆中國R會議數據可視化演講嘉賓;學術研究方向為顏色科學、機器視覺、數據分析與可視化等。
名人推薦:
English only documentation is starting to be a major problem for the scientific python ecosystem. This book provides an introduction to the basic usage of Matplotlib, the underlying structure of the architecture, and several of the high-level libraries built on top of matplotlib. Hopefully, this book will provide the context needed for Chinese speakers to better approach and understand the canonical English documentation of the projects.
Python語言生態圈有一個很主要的問題就是只有英文參考文件。本書介紹了matplotlib套件的基本用法和底層架構,以及建構在Matplotlib套件上幾個高水準的套件(Plotnine、Seaborn和Basemap等)。希望這本書能給中文讀者提供所需的學習內容,更好地幫助讀者學習與了解這些經典的英文技術文件。
Thomas Caswell
Lead Developer of matplotlib ( matplotlib套件的首席開發者)
Github: https://github.com/tacaswell
When trying to understand or communicate information one usually asks, what is the best visualization(s) I can make? If this question often comes to you and that you tend not to have an answer, then "Beautiful Visualizations with Python" is meant for you. Python is an excellent language for data analysis and visualization. Secondly, the book helps you build a practical toolbox for most visualizations that you may want to create. It strikes a delicate balance between a book that introduces and teaches and a gallery that you can always come back to for ideas. It is not one to throw away after reading. As it is titled, you will learn how to turn data in into beautiful visualizations by making the best choices at every step. Most important for me is that it covers the biggest idea in data visualization in the last 20 years, that is, "The Grammar of Graphics".
當盡力去理解與溝通某人常問的資料資訊時,什麼才是我可以實現的資料視覺化?如果你也經常遇到這個問題,而又沒有答案時,這本書就是專門為你準備的。Python是一門用於資料分析與可視化非常優秀的語言,而這本書可以幫你建立你的工具箱,進一步可以實現你想做的大部分的資料視覺化。這本書不僅能給你介紹、教你資料視覺化,而且能幫你尋找資料視覺化的靈感,兩者兼得。這不是一本你看完就可以束之高閣的書。正如這本書名,你會透過本書一步步的教學模式,學習到如何將資料轉換成優美的圖表。更重要的是,這本書涵蓋了近20年來資料視覺化的核心理念,即「圖形語法」。
Hassan Kibirige
Author/ Maintainer of plotnine ( plotnine套件的開發者與維護者)
Github: https://github.com/has2k1
退換貨說明:
會員均享有10天的商品猶豫期(含例假日)。若您欲辦理退換貨,請於取得該商品10日內寄回。
辦理退換貨時,請保持商品全新狀態與完整包裝(商品本身、贈品、贈票、附件、內外包裝、保證書、隨貨文件等)一併寄回。若退回商品無法回復原狀者,可能影響退換貨權利之行使或須負擔部分費用。
訂購本商品前請務必詳閱退換貨原則。最多人成交
平均成交價47折367元
最近成交價(折扣)
| 徵求價 | 數量 |
| 2折 | 2 |
| 3折 | 2 |
| 4折 | 1 |
| 5折 | 2 |
| 8折以上 | 2 |
影片僅供參考,實物可能因再版或再刷而有差異
作者:張傑
3收藏
9二手徵求有驚喜
優惠價: 9 折, NT$ 702 NT$ 780
運送方式:超商取貨、宅配取貨
銷售地區:全球
訂購後,立即為您進貨
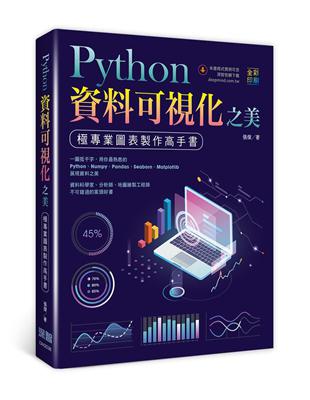
全書從Python程式語言切入,讓不懂Python的讀者也能快速上手。之後介紹處理數值最重要的套件包括NumPy和Pandas,接下來就是Python最重要的繪圖套件,包括matplotlib、Seaborn和plotnine的圖形語法,以及資料視覺化的顏色主題運用原理。在熟悉了工具之後,就進入本書的高潮,製作各式各樣的圖表,包括直條圖系列、橫條圖系列、南丁格爾玫瑰圖、徑向柱圖等圖表。還有資料關聯式圖表,包含二維和三維散點圖、氣泡圖、等高線圖、立體曲面圖、三元相圖、二維和三維瀑布圖、相關係數熱力圖等。最後更直接畫出了「商業週刊」、「華爾街日報」、「經濟學人」等刊物中最專業的圖表,直接晉升成大師行列。
作者簡介:
張傑
【獅猿狗】數據分析-工業設計獅,程序猿,科研狗。微信公眾號【EasyShu】聯合主創。
著有15篇SCI(E)和SSCI學術論文;出版專著《Excel 數據之美:科學圖表與商業圖表的繪製》、《R語言數據可視化之美:專業圖表繪製指南》、《Python數據可視化之美:專業圖表繪製指南》。
多屆中國R會議數據可視化演講嘉賓;學術研究方向為顏色科學、機器視覺、數據分析與可視化等。
名人推薦:
English only documentation is starting to be a major problem for the scientific python ecosystem. This book provides an introduction to the basic usage of Matplotlib, the underlying structure of the architecture, and several of the high-level libraries built on top of matplotlib. Hopefully, this book will provide the context needed for Chinese speakers to better approach and understand the canonical English documentation of the projects.
Python語言生態圈有一個很主要的問題就是只有英文參考文件。本書介紹了matplotlib套件的基本用法和底層架構,以及建構在Matplotlib套件上幾個高水準的套件(Plotnine、Seaborn和Basemap等)。希望這本書能給中文讀者提供所需的學習內容,更好地幫助讀者學習與了解這些經典的英文技術文件。
Thomas Caswell
Lead Developer of matplotlib ( matplotlib套件的首席開發者)
Github: https://github.com/tacaswell
When trying to understand or communicate information one usually asks, what is the best visualization(s) I can make? If this question often comes to you and that you tend not to have an answer, then "Beautiful Visualizations with Python" is meant for you. Python is an excellent language for data analysis and visualization. Secondly, the book helps you build a practical toolbox for most visualizations that you may want to create. It strikes a delicate balance between a book that introduces and teaches and a gallery that you can always come back to for ideas. It is not one to throw away after reading. As it is titled, you will learn how to turn data in into beautiful visualizations by making the best choices at every step. Most important for me is that it covers the biggest idea in data visualization in the last 20 years, that is, "The Grammar of Graphics".
當盡力去理解與溝通某人常問的資料資訊時,什麼才是我可以實現的資料視覺化?如果你也經常遇到這個問題,而又沒有答案時,這本書就是專門為你準備的。Python是一門用於資料分析與可視化非常優秀的語言,而這本書可以幫你建立你的工具箱,進一步可以實現你想做的大部分的資料視覺化。這本書不僅能給你介紹、教你資料視覺化,而且能幫你尋找資料視覺化的靈感,兩者兼得。這不是一本你看完就可以束之高閣的書。正如這本書名,你會透過本書一步步的教學模式,學習到如何將資料轉換成優美的圖表。更重要的是,這本書涵蓋了近20年來資料視覺化的核心理念,即「圖形語法」。
Hassan Kibirige
Author/ Maintainer of plotnine ( plotnine套件的開發者與維護者)
Github: https://github.com/has2k1
退換貨說明:
會員均享有10天的商品猶豫期(含例假日)。若您欲辦理退換貨,請於取得該商品10日內寄回。
辦理退換貨時,請保持商品全新狀態與完整包裝(商品本身、贈品、贈票、附件、內外包裝、保證書、隨貨文件等)一併寄回。若退回商品無法回復原狀者,可能影響退換貨權利之行使或須負擔部分費用。
訂購本商品前請務必詳閱退換貨原則。| 徵求價 | 數量 |
| 2折 | 2 |
| 3折 | 2 |
| 4折 | 1 |
| 5折 | 2 |
| 8折以上 | 2 |
最多人成交
平均成交價47折367元
最近成交價(折扣)

請在手機上開啟Line應用程式,點選搜尋欄位旁的掃描圖示
即可掃描此ORcode